SLAI
Income statement / Annual
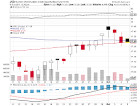
Last year (2025), SOLAI Ltd.'s total revenue was $23.06 M,
a decrease of 90.40% from the previous year.
In 2025, SOLAI Ltd.'s net income was -$33.97 M.
See SOLAI Ltd.,s key income statements, including revenue, expenses, profit, and income.
| Period |
FY-2025
|
FY-2024
|
FY-2023
|
FY-2022
|
FY-2021
|
FY-2020
|
FY-2019
|
FY-2018
|
FY-2017
|
FY-2016
|
| Period Ended |
12/31/2025 |
12/31/2024 |
12/31/2023 |
12/31/2022 |
12/31/2021 |
12/31/2020 |
12/31/2019 |
12/31/2018 |
12/31/2017 |
12/31/2016 |
| Operating Revenue |
$23.06 M |
$240.30 M |
$43.10 M |
$393.30 M |
$341.71 M |
$14.15 M |
$35.94 M |
$131.01 M |
$71.86 M |
$5.26 M |
| Cost of Revenue |
$33.88 M
|
$218.51 M
|
$40.06 M
|
$62.71 M
|
$251.08 M
|
$19.53 M
|
$66.41 M
|
$80.02 M
|
$37.48 M
|
$12.75 M
|
| Gross Profit |
-$10.82 M
|
$21.79 M
|
$3.05 M
|
-$5.75 M
|
$90.63 M
|
$2.29 M
|
-$26.72 M
|
$46.07 M
|
$34.38 M
|
-$7.49 M
|
| Gross Profit Ratio |
-0.47
|
0.09
|
0.07
|
-0.01
|
0.27
|
0.16
|
-0.74
|
0.35
|
0.48
|
-1.42
|
| Research and Development Expenses |
$0.00
|
$69.00 K
|
$874.00 K
|
$3.67 M
|
$3.16 M
|
$30.20 M
|
$48.61 M
|
$61.91 M
|
$58.59 M
|
$71.60 M
|
| General & Administrative Expenses |
$0.00
|
$13.71 M
|
$18.47 M
|
$22.79 M
|
$25.76 M
|
$27.97 M
|
$37.73 M
|
$45.54 M
|
$43.33 M
|
$45.50 M
|
| Selling & Marketing Expenses |
$0.00
|
$54.00 K
|
$153.00 K
|
$633.00 K
|
$887.00 K
|
$2.56 M
|
$6.07 M
|
$13.44 M
|
$9.69 M
|
$6.47 M
|
| Selling, General & Administrative Expenses |
$18.35 M
|
$13.76 M
|
$18.62 M
|
$23.42 M
|
$26.71 M
|
$30.53 M
|
$43.80 M
|
$58.99 M
|
$53.03 M
|
$51.97 M
|
| Other Expenses |
$3.04 M
|
$66.39 M
|
$8.75 M
|
-$4.20 M
|
$342.40 M
|
-$43.60 M
|
-$21.21 M
|
$269.67 M
|
$261.29 M
|
$237.13 M
|
| Operating Expenses |
$21.39 M
|
$80.22 M
|
$28.24 M
|
$22.88 M
|
$372.27 M
|
$17.14 M
|
$71.20 M
|
$390.56 M
|
$372.91 M
|
$360.69 M
|
| Cost And Expenses |
$55.27 M
|
$298.73 M
|
$68.29 M
|
$1.01 B
|
$623.35 M
|
$125.03 M
|
$550.87 M
|
$509.98 M
|
$410.39 M
|
$373.44 M
|
| Interest Income |
$146.39 K
|
$2.00 K
|
$242.00 K
|
$150.00 K
|
$56.00 K
|
$242.00 K
|
$1.31 M
|
$2.23 M
|
$3.07 M
|
$3.44 M
|
| Interest Expense |
$0.00
|
$0.00
|
$0.00
|
$218.00 K
|
$775.00 K
|
$0.00
|
$0.00
|
$0.00
|
$0.00
|
$0.00
|
| Depreciation & Amortization |
$18.08 M
|
$13.22 M
|
$12.57 M
|
$188.39 M
|
$20.82 M
|
$50.11 M
|
$78.84 M
|
$62.54 M
|
$6.05 M
|
$19.71 M
|
| EBITDA |
-$14.12 M |
$6.21 M |
-$12.82 M |
-$24.66 M |
-$3.32 M |
-$136.32 M |
-$261.77 M |
-$281.95 M |
-$45.80 M |
-$338.50 M |
| EBITDA Ratio |
-0.61
|
0.03
|
-0.3
|
-0.06
|
-0.01
|
-9.64
|
-7.28
|
-2.15
|
-0.64
|
-64.37
|
| Operating Income Ratio |
-1.4
|
-0.05
|
-0.58
|
-0.07
|
-0.07
|
-13.18
|
-14.33
|
-2.63
|
-4.71
|
-70.01
|
| Total Other Income/Expenses Net |
-$2.36 M
|
$3.84 M
|
-$191.00 K
|
-$50.70 M
|
-$42.94 M
|
-$26.05 M
|
-$13.78 M
|
-$146.85 M
|
-$6.96 M
|
$160.37 M
|
| Income Before Tax |
-$34.57 M
|
-$51.15 M
|
-$25.38 M
|
-$79.33 M
|
-$67.08 M
|
-$212.48 M
|
-$528.71 M
|
-$491.34 M
|
-$345.49 M
|
-$207.82 M
|
| Income Before Tax Ratio |
-1.5
|
-0.21
|
-0.59
|
-0.2
|
-0.2
|
-15.02
|
-14.71
|
-3.75
|
-4.81
|
-39.52
|
| Income Tax Expense |
$0.00
|
$0.00
|
$0.00
|
-$3.01 M
|
$358.25 K
|
-$30.00 K
|
-$1.08 M
|
-$19.60 M
|
-$14.03 M
|
$2.14 M
|
| Net Income |
-$33.97 M
|
$12.07 M
|
-$28.71 M
|
-$155.42 M
|
-$55.78 M
|
-$32.41 M
|
-$649.51 M
|
-$451.67 M
|
-$317.10 M
|
-$29.23 M
|
| Net Income Ratio |
-1.47
|
0.05
|
-0.67
|
-0.4
|
-0.16
|
-2.29
|
-18.07
|
-3.45
|
-4.41
|
-5.56
|
| EPS |
-1.97 |
-0.58 |
-2.6 |
-19 |
-4.45 |
-35 |
-122 |
-113 |
-80 |
-51 |
| EPS Diluted |
-1.97 |
-0.56 |
-2.6 |
-18 |
-4.45 |
-35 |
-122 |
-110 |
-76 |
-49 |
| Weighted Average Shares Out |
$17.27 M
|
$11.72 M
|
$11.02 M
|
$8.34 M
|
$6.22 M
|
$5.98 M
|
$5.41 M
|
$4.09 M
|
$3.96 M
|
$4.14 M
|
| Weighted Average Shares Out Diluted |
$17.27 M
|
$11.72 M
|
$11.02 M
|
$8.71 M
|
$6.22 M
|
$4.30 M
|
$4.29 M
|
$4.19 M
|
$4.08 M
|
$4.15 M
|
| Link |
|
|
|
|
|
|
|
|
|
|