


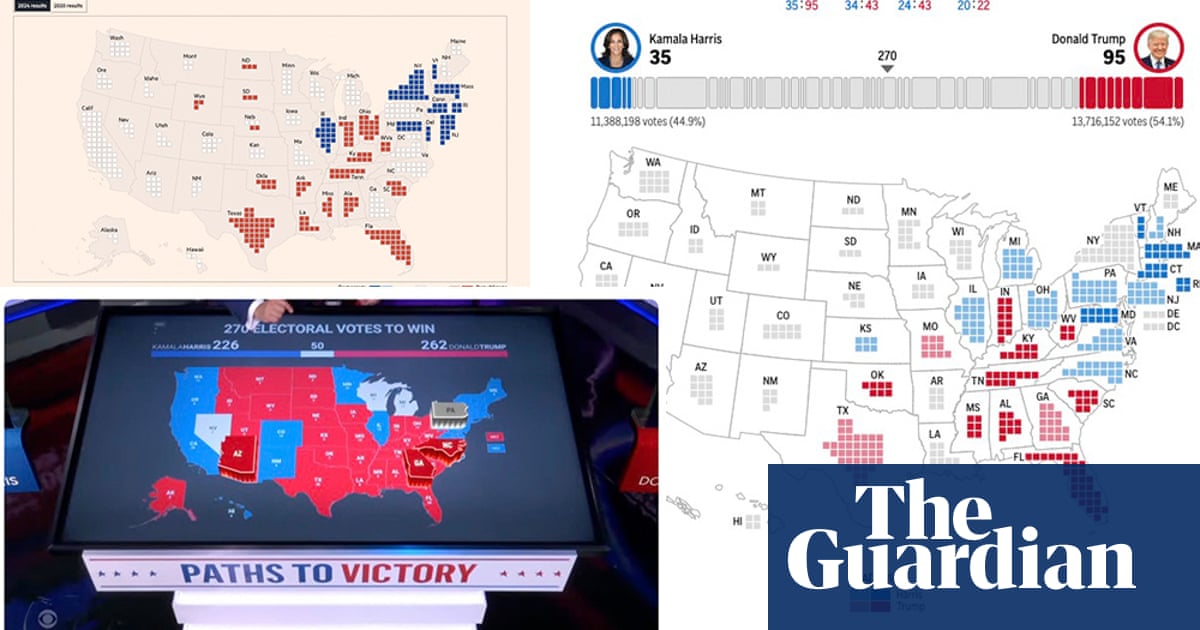
Sign up for The Crunch newsletter for fortnightly updates. The latest edition covers unique graphics from the US election, including cartograms, map features, and insightful data analysis. Stay informed with engaging visuals and analytical content. Email any chart tips or technical issues.
Read MoreDid you find this insightful?
Bad
Just Okay
Amazing